Skew
Uncover Hidden Market Opportunities
The Volatility Skew tracks the pattern of varying implied volatility levels across options with different strike prices but the same expiration date. It illustrates how the market perceives the risk of price movements in an underlying asset at various levels above or below the current price. Understanding Volatility Skew is crucial for options traders as it can influence their strategies as well pricing spreads.
-

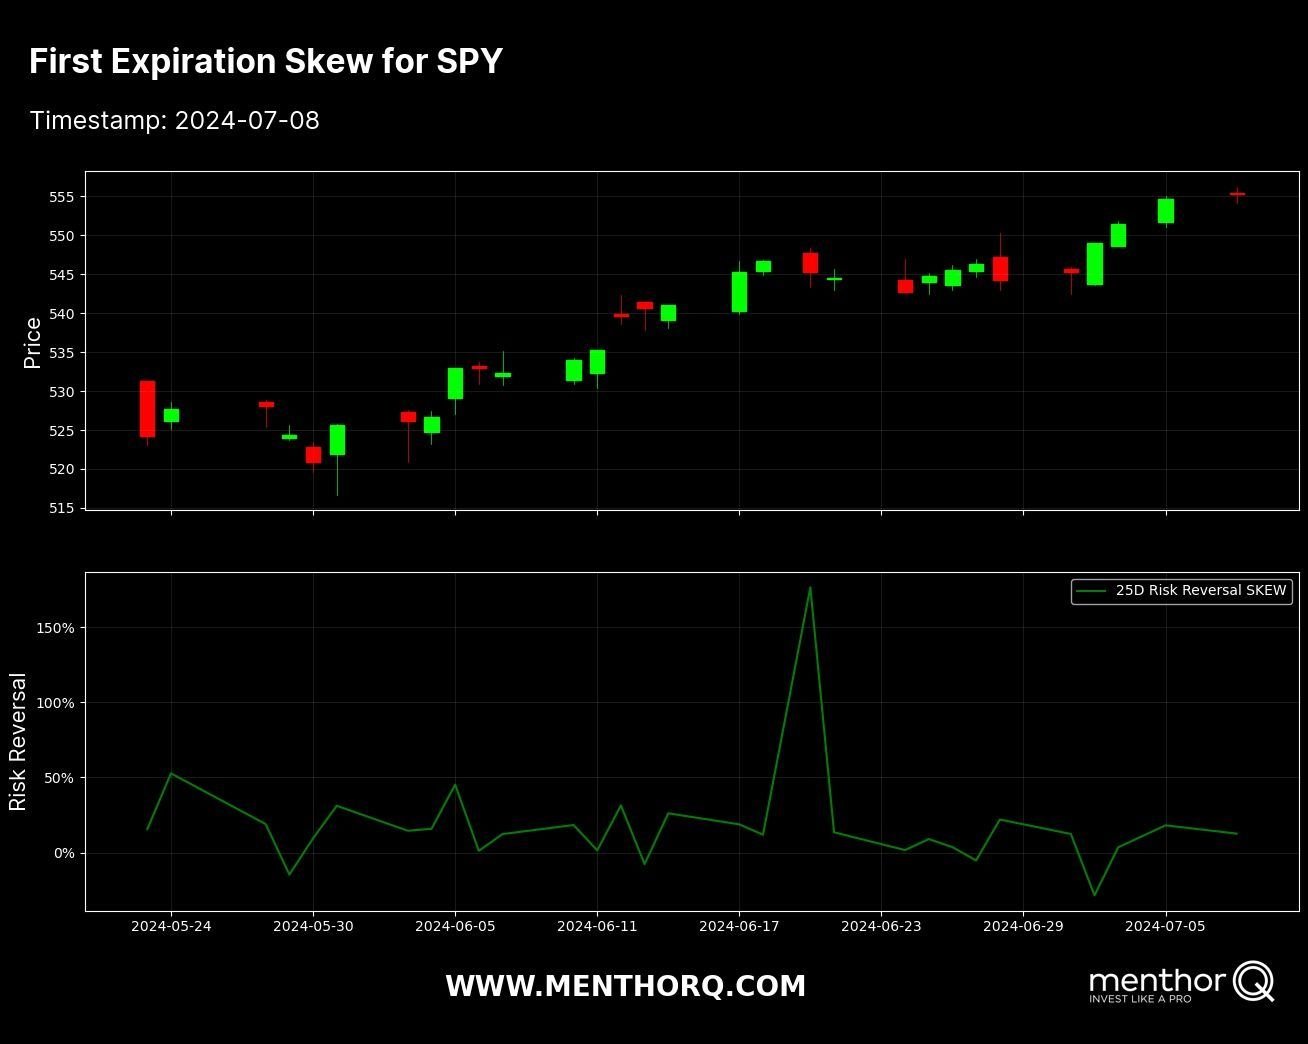
0DTE Skew
Our 0DTE (zero days to expiration) or First Expirations Skew analysis provides insights into the market’s risk perception for options expiring on the same day or week. This tool is key for traders and short-term investors, enabling them to understand the immediate market sentiment and volatility patterns.
-

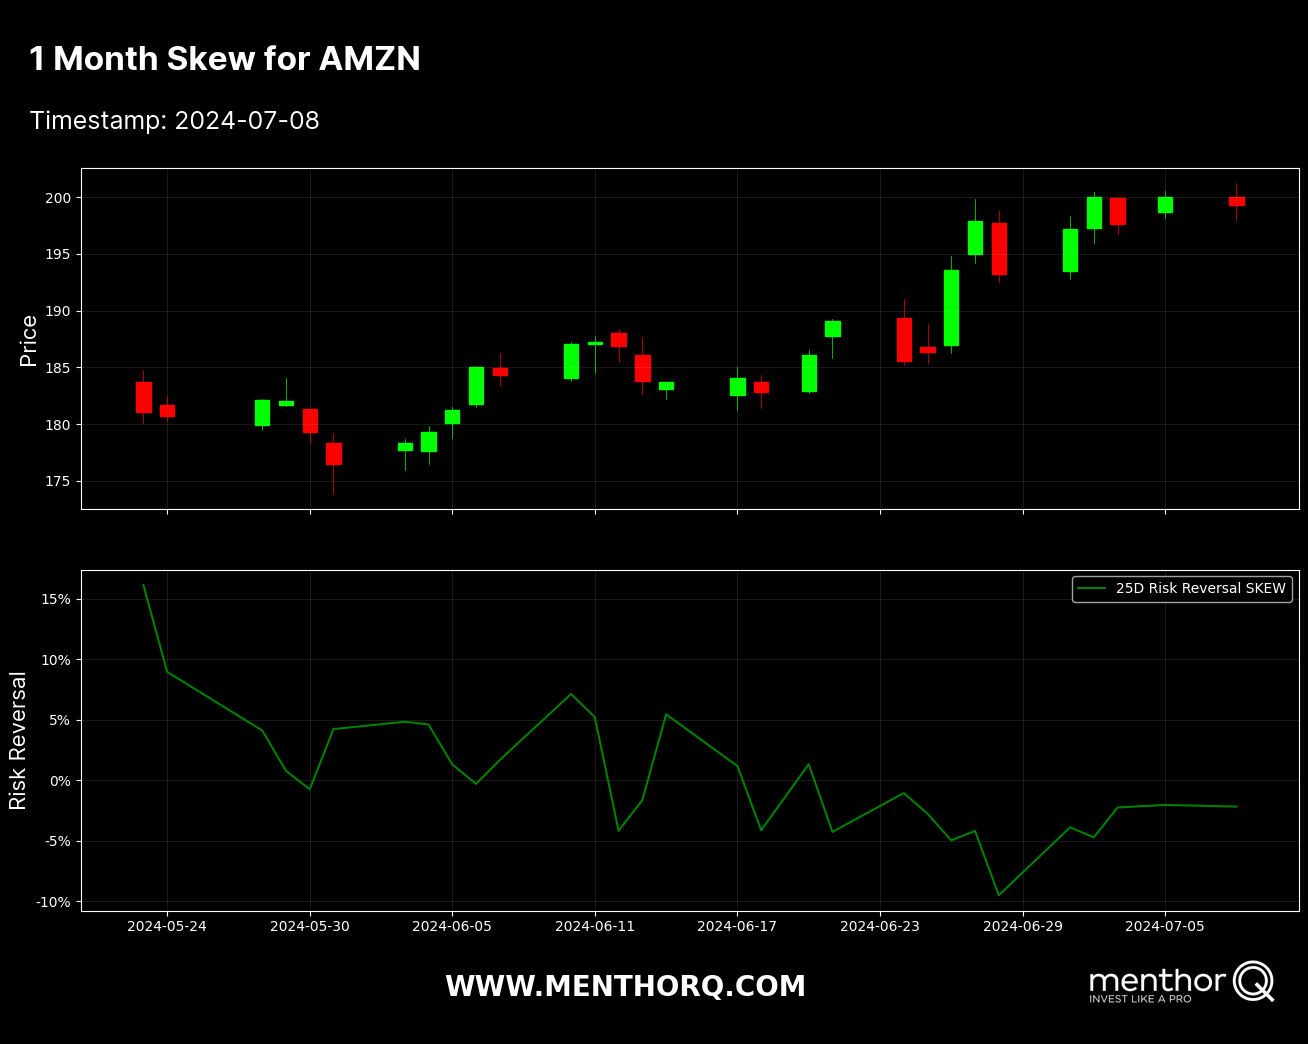
1-Month Skew
The 1-Month Skew analysis offers a broader perspective on market sentiment for options expiring within one month. This medium-term skew analysis helps traders and investors gauge how the market perceives risk over the next 30 days. By understanding the implied volatility across different strike prices for the coming month, traders can better manage their positions, anticipate potential price movements, and adjust their strategies to balance risk and reward effectively.
-

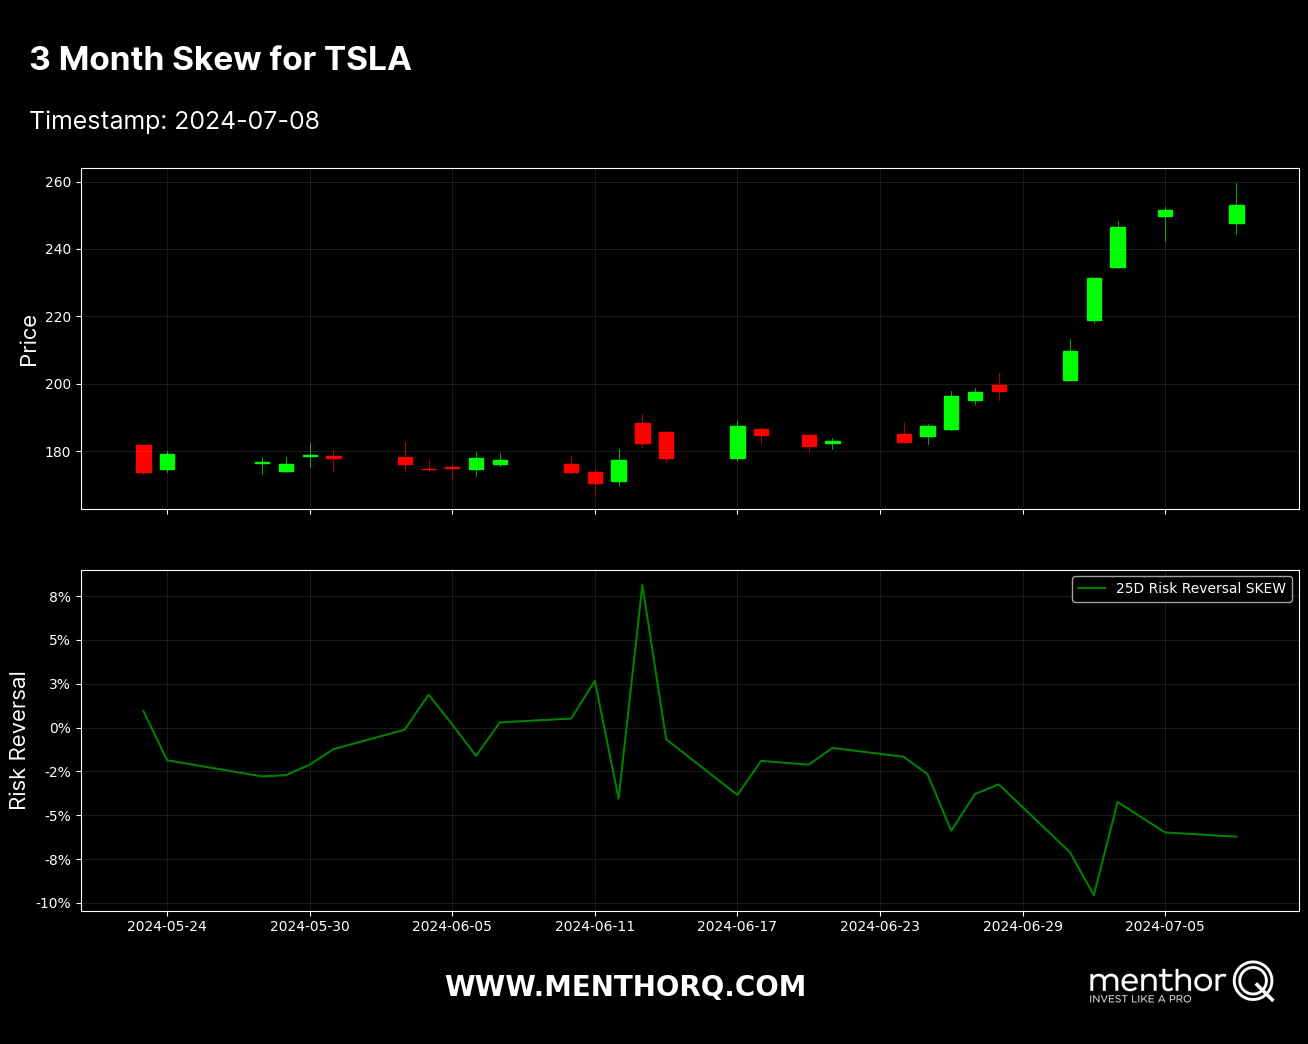
3-Months Skew
Our 3-Months Skew analysis provides a comprehensive view of the market’s risk perception for options expiring over the next three months. This long-term skew analysis is essential for investors and traders looking to plan their strategies over a quarter. By analyzing the volatility skew for this extended period, users can identify trends, forecast potential market shifts, and develop robust trading strategies that account for longer-term market dynamics and risk factors.


