Implied Volatility per Open Interest
Leveraging Implied Volatility and Open Interest to identify Sticky Strikes
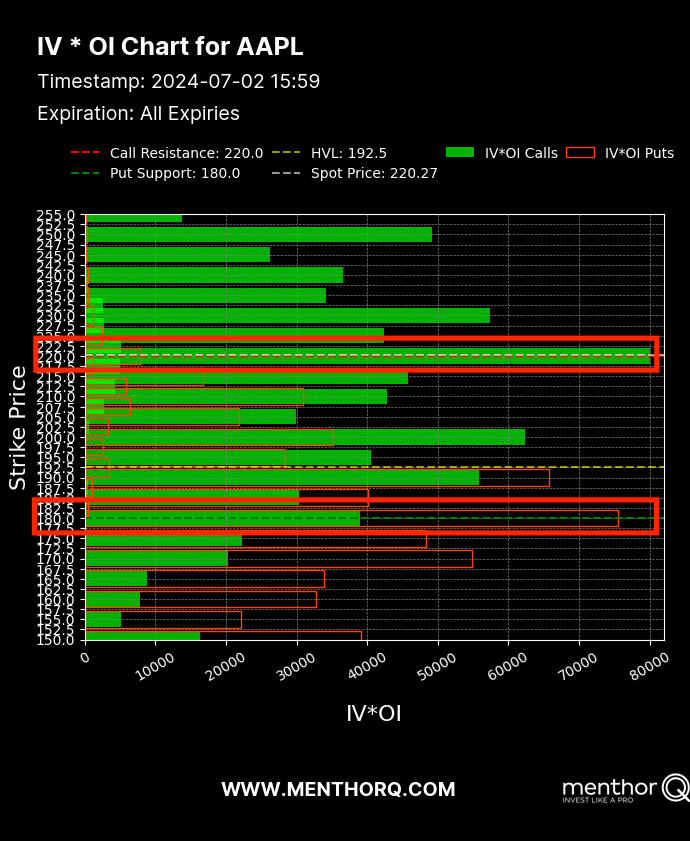
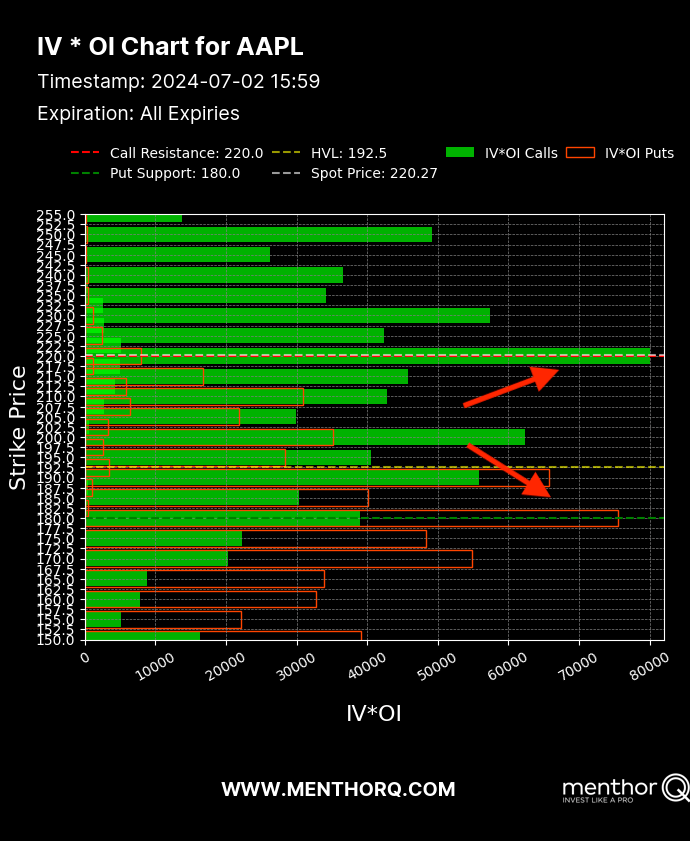
This model aggregates Implied Volatility and Open Interest by strike. It helps to confirm which strikes are more sticky from an Open Interest and Implied Volatility perspective. Spikes help identify strike levels that have both high Open Interest and high Volatility. Those strikes generally become sticky strikes. This chart can be used in conjunction with the Menthor Q Key Levels and Net Gamma Exposure for confirmation.
-

Sticky Strikes
Higher IV reflects increased demand for options at specific strikes. Open interest (OI) confirms the “stickiness” of these strikes.
Monitoring IV and OI helps identify market trends by showing the level of trading activity and investor interest in specific strikes.
A spike indicates significant open interest (OI) nodes and high volatility at that strike.
-

Market Sentiment
Tracking open interest and IV provides insights into investor sentiment and potential price direction.


