Momentum Models
Harnessing Momentum Models and Market Breadth Analysis
The Menthor Q Momentum Models are designed to help investors assess the strength and direction of market trends. These models use various technical indicators and data points to provide insights into market momentum. By analyzing factors such as price trends, volatility, and volume, the Momentum Models offer a comprehensive view of market dynamics, aiding in the prediction of trend continuations or reversals.
-
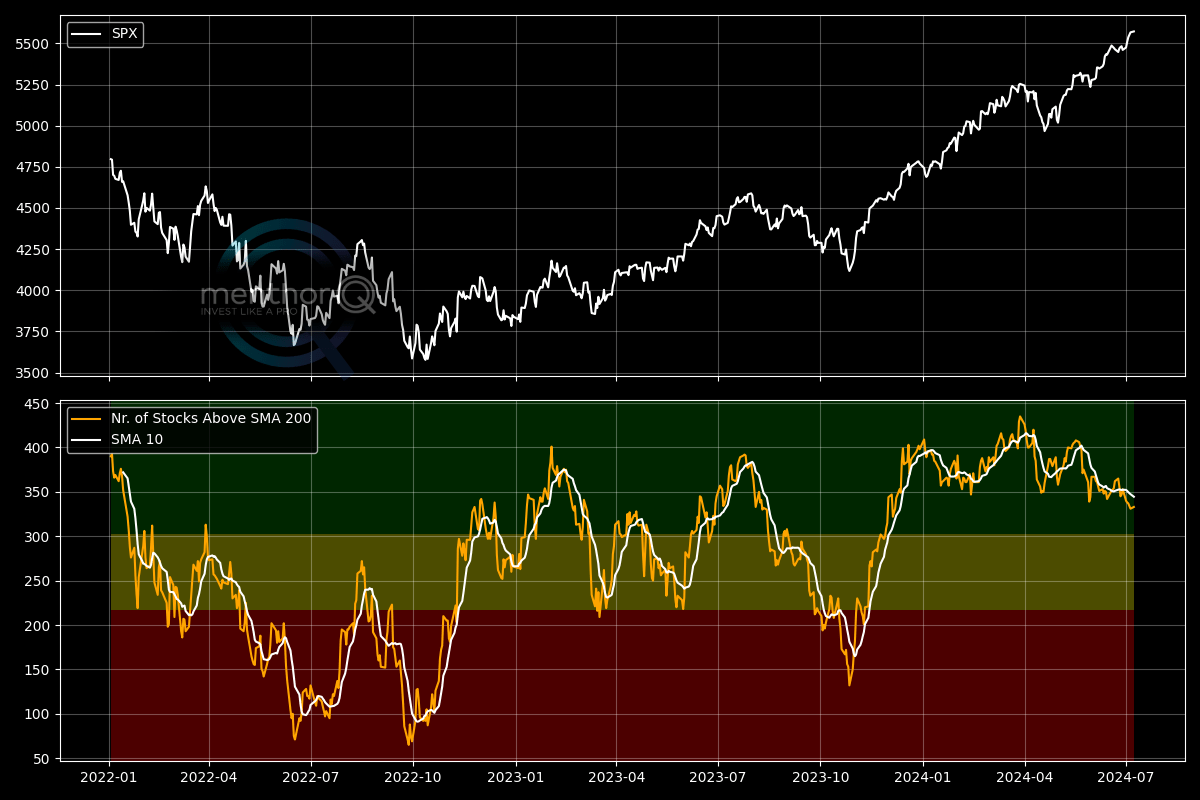
Market Breadth
The Menthor Q Market Breadth tracks the percentage of S&P 500 stocks trading above their 200-day moving averages, signaling overall market health and direction. A high proportion above this average indicates widespread bullish sentiment, while fewer stocks above it may suggest underlying market weakness. This indicator helps investors assess whether market movements are broad-based or driven by a few stocks, providing early warnings of potential trend reversals or corrections.
-
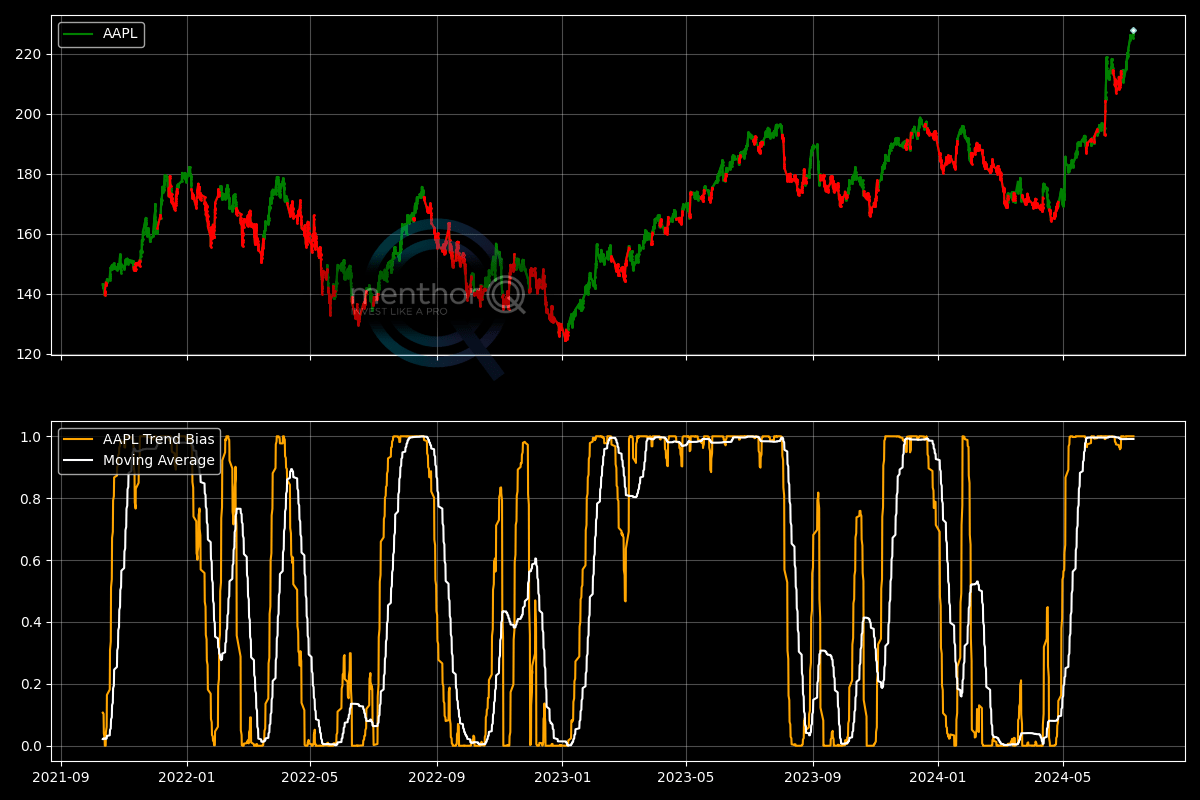
Trend Bias
The Trend Bias Indicator evaluates a subset of moving averages to identify bullish crosses (fast MA > slow MA). This data generates a trend model, shown as an oscillator indicating the likely trend. The graph’s upper part highlights past trends: green for probable bullish and red for likely bearish trends.
-
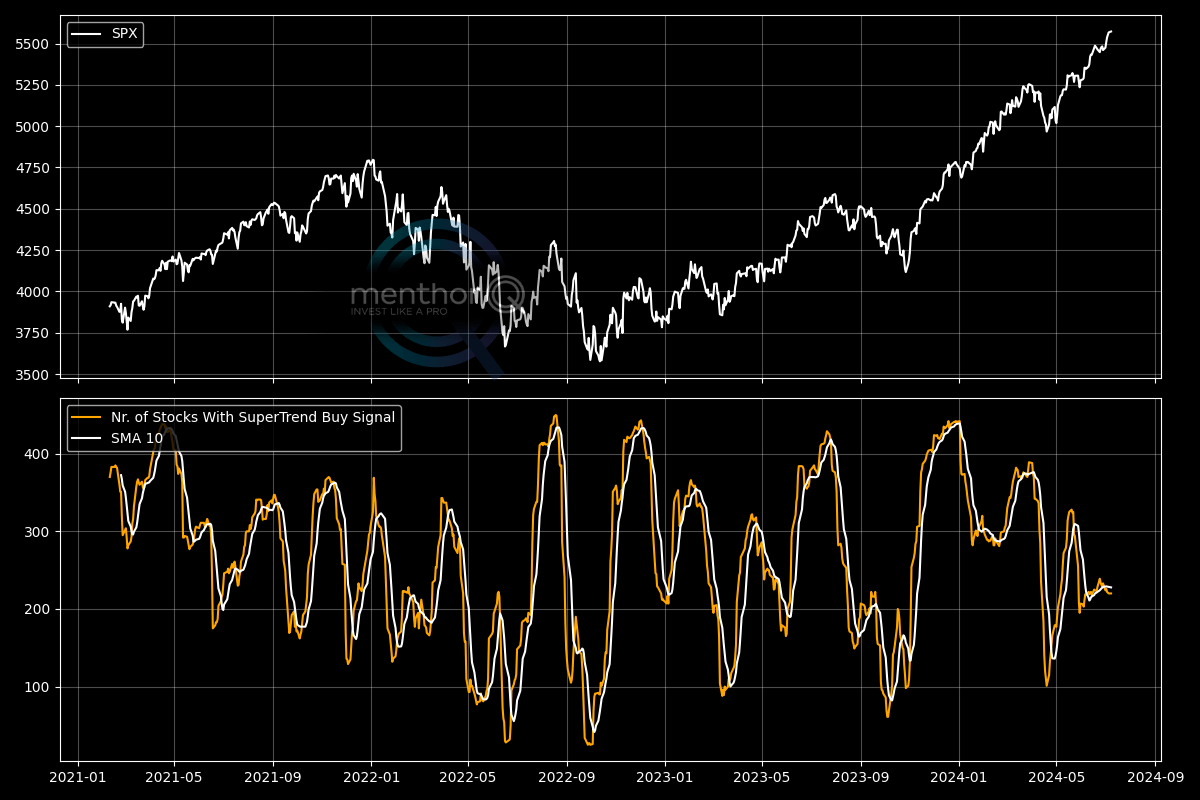
Super Trend
The Supertrend indicator, a trend-following overlay similar to moving averages, uses ATR and a multiplier to determine trend direction. It tracks the number of S&P 500 stocks in a Super Trend Buy Signal mode. -
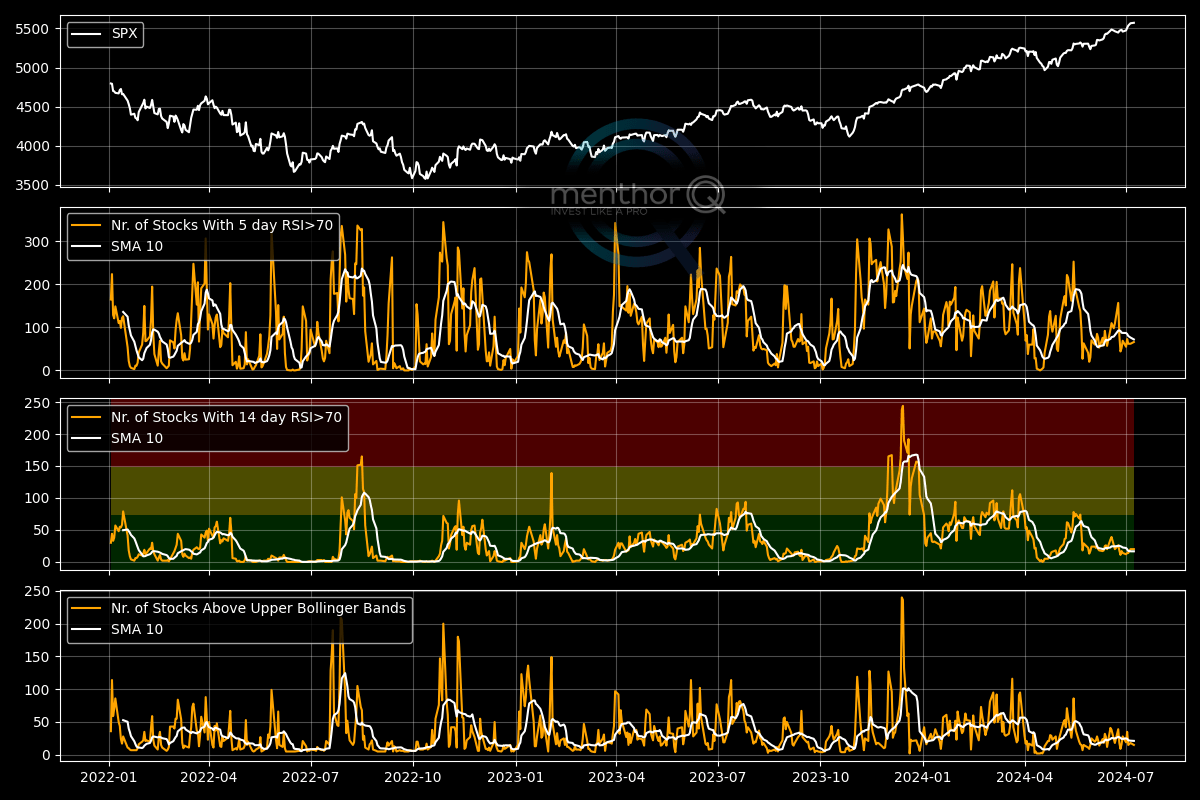
RSI & Bollinger Bands
The Menthor Q RSI and Bollinger Bands Indicator is presented in a 4-chart format:
- First Pane: Shows the S&P 500 Index.
- Second Pane: Displays the number of stocks with a 5-day RSI above 70 (overbought condition).
- Third Pane: Displays the number of stocks with a 14-day RSI above 70 (overbought condition).
- Fourth Pane: Shows the number of stocks trading above their upper Bollinger Band.
-
Moving Averages
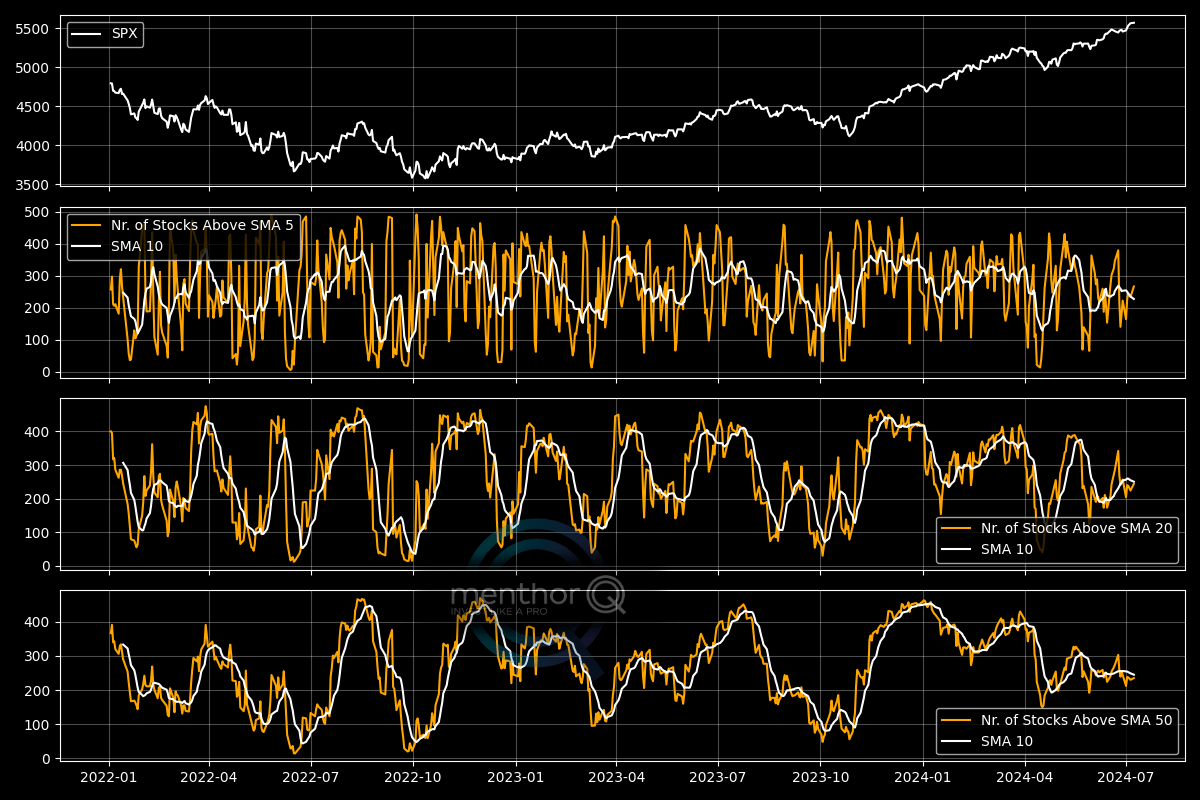
Similar to Market Breadth for the 200-day moving average, this indicator uses shorter-term averages and is displayed in a 4-pane chart:
- Price of the Asset
- Number of Stocks above the 5D SMA
- Number of Stocks above the 20D SMA
- Number of Stocks above the 50D SMA
Reading the Indicator:
- Many stocks above their short-term MAs (like 20D or 50D) suggest broad market strength and positive momentum.
- Few stocks above their short-term MAs indicate market weakness or bearish momentum.
- Significant changes in these numbers can signal trend reversals; for example, many stocks rising above their short-term MAs after a bear market can suggest a bullish reversal.
-
MACD
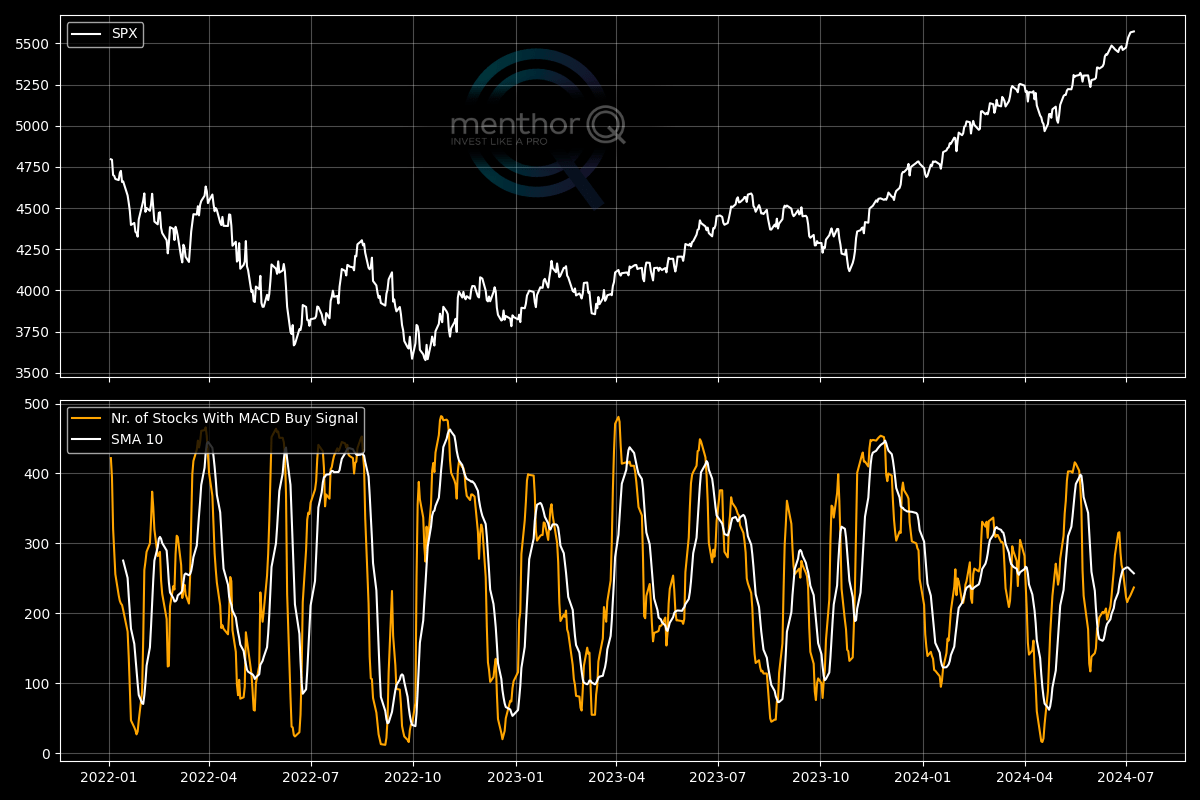
The Moving Average Convergence Divergence (MACD) is a trend-following momentum indicator that shows the relationship between two moving averages of a security’s price. The MACD is calculated by subtracting the 26-period Exponential Moving Average (EMA) from the 12-period EMA. The result of that calculation is the MACD line. A nine-day EMA of the MACD called the “signal line,” is then plotted on top of the MACD line, which can function as a trigger for buy and sell signals.


