(function(){
var CN = 'menthorq_utm_params';
var LK = 'menthorq_utm_params';
var UK = ['utm_source','utm_medium','utm_campaign','utm_term','utm_content','utm_id'];
var CK = ['gclid','gbraid','wbraid','gad_campaignid','fbclid','msclkid','ttclid','twclid'];
// gbraid is not unique; gad_campaignid from the same hit is the campaign reference.
// Replace this whole Google bundle together so a later landing cannot pair a new gbraid with an old campaign id.
var GK = ['gclid','gbraid','wbraid','gad_campaignid'];
var CD = 30;
var AK = UK.concat(CK);function sC(n,v,d){var e=new Date(Date.now()+d*864e5).toUTCString();var c=n+'='+encodeURIComponent(v)+';expires='+e+';path=/;SameSite=Lax';if(location.protocol==='https:')c+=';Secure';document.cookie=c;}
function gC(n){var m=document.cookie.match(new RegExp('(?:^|; )'+n+'=([^;]*)'));return m?decodeURIComponent(m[1]):'';}
function sv(d){var j=JSON.stringify(d);sC(CN,j,CD);try{localStorage.setItem(LK,j);}catch(e){}}
function hk(o){if(!o)return false;for(var i=0;i<AK.length;i++)if(o[AK[i]])return true;return false;}
function nm(d){if(!d)return null;if(d.first)return d;if(hk(d))return{first:d,last:d};return null;}
function ld(){var r=gC(CN);if(r){try{var n=nm(JSON.parse(r));if(n)return n;}catch(e){}}try{var s=localStorage.getItem(LK);if(s){var n=nm(JSON.parse(s));if(n)return n;}}catch(e){}return null;}
function mg(p,n){var o={};if(p)for(var k in p)o[k]=p[k];for(var k in n)o[k]=n[k];return o;}
function hasK(o,keys){if(!o)return false;for(var i=0;i<keys.length;i++)if(o[keys[i]])return true;return false;}
function mgGoogle(p,n){
var o=mg(p,n);
if(!hasK(n,GK))return o;
for(var i=0;i<GK.length;i++){
var k=GK[i];
if(n[k])o[k]=n[k];
else delete o[k];
}
return o;
}
function completeGbraidPair(first,incoming){
if(first.gbraid && !first.gad_campaignid && incoming.gad_campaignid && incoming.gbraid===first.gbraid){
var o={};for(var k in first)o[k]=first[k];o.gad_campaignid=incoming.gad_campaignid;return o;
}
return first;
}var ps = new URLSearchParams(window.location.search);
var fd = {}, has = false;
for (var i = 0; i < AK.length; i++) {
var v = ps.get(AK[i]);
if (v) { fd[AK[i]] = v; has = true; }
}// Click-ID synthesis: when only a click-id is present (no utm_source), derive
// utm_source/utm_medium so downstream analytics groups under the right channel.
var SY = {
gclid: ['google', 'cpc'],
gbraid: ['google', 'cpc'],
wbraid: ['google', 'cpc'],
gad_campaignid: ['google', 'cpc'],
fbclid: ['facebook', 'cpc'],
msclkid: ['bing', 'cpc'],
ttclid: ['tiktok', 'cpc'],
twclid: ['twitter', 'cpc']
};
if (has && !fd.utm_source) {
for (var sk in SY) {
if (fd[sk]) { fd.utm_source = SY[sk][0]; fd.utm_medium = SY[sk][1]; break; }
}
}
if (has && !fd.utm_campaign && fd.gad_campaignid) {
fd.utm_campaign = fd.gad_campaignid;
}if (has) {
fd.captured_at = new Date().toISOString();
var ex = ld();
// Last-touch: merge new fields ON TOP of previous last (preserva campi pregressi).
// Google Ads keys are replaced as one bundle from this hit.
var newLast = ex && ex.last ? mgGoogle(ex.last, fd) : fd;
// First-touch: se ex.first ha almeno un UTM, e' completo e sticky.
// Se ex.first esiste ma e' click-id-only (orphan), completa con i campi nuovi.
// Se ex.first non esiste, usa fd come first.
// Google pair (gbraid + gad_campaignid) stays sticky once captured; only complete
// a missing campaign id when gbraid on this hit matches first-touch gbraid.
var newFirst;
if (ex && ex.first) {
var firstHasUtm = false;
for (var i = 0; i < UK.length; i++) if (ex.first[UK[i]]) { firstHasUtm = true; break; }
if (firstHasUtm || hasK(ex.first, GK)) {
newFirst = completeGbraidPair(ex.first, fd);
} else {
newFirst = mgGoogle(ex.first, fd);
}
} else {
newFirst = fd;
}
sv({first: newFirst, last: newLast});
return;
}var raw = gC(CN);
if (raw) {
try {
var p = JSON.parse(raw);
if (!p.first && hk(p)) sv({first: p, last: p});
} catch(e) {}
return;
}try {
var s = localStorage.getItem(LK);
if (s) { var n = nm(JSON.parse(s)); if (n) sv(n); }
} catch(e) {}
})();
var breeze_prefetch = {"local_url":"https://menthorq.com","ignore_remote_prefetch":"1","ignore_list":["/account/","/login/","/thank-you/","/wp-json/openid-connect/userinfo","wp-admin","wp-login.php"]};
//# sourceURL=breeze-prefetch-js-extra
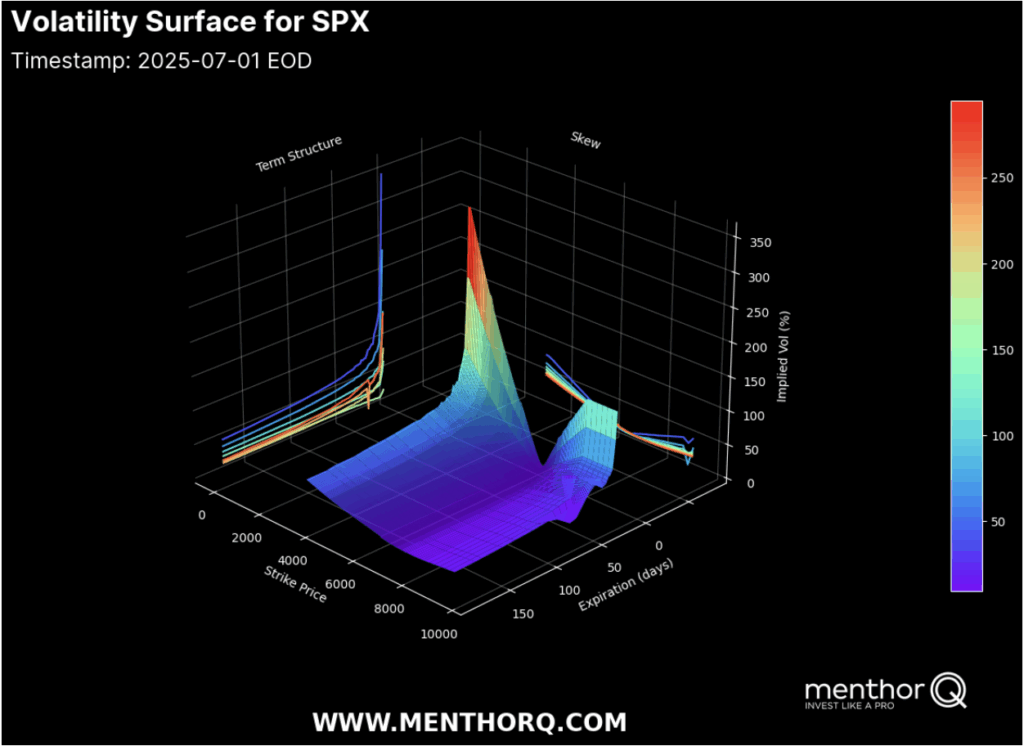
Your first chart is the Volatility Surface for SPX, which shows the implied volatility for different strike prices and times to expiration. This three-dimensional plot combines two crucial dimensions:
Term Structure: the curve that shows how implied volatility changes over time. In calm conditions, the curve is upward sloping (contango): short-term IV is lower than longer-term IV. That’s because traders see less near-term risk but want protection against longer-term surprises.
Skew: how implied volatility changes across strike prices at each expiry. Usually, OTM puts have higher IV than calls because traders pay up for crash protection. But that balance can flip when calls are heavily bid during squeezes.
In this example, the surface shows a healthy contango: near-term implied vol is much lower than long-term vol. That means the market expects calm conditions for now but is still hedging for event risk further out. There’s also a visible ridge in the wings, meaning traders are willing to pay up for tail protection.
The volatility surface says the near-term window favors premium selling, or trades that benefit from stable realized vol. But longer-dated wings tell you that macro risk is not fully gone. You might combine these insights by using calendar spreads or diagonal structures that exploit the short-term calm and back-end caution.
Vol Surface, Skew & GEX 11
Skew — What Call Bias Means
The second chart is the 1-Month Skew for SPX, showing the 25 Delta risk reversal — the difference in implied vol between puts and calls, normalized by ATM IV. The risk reversal shows you whether traders are paying up for downside protection (put bias) or upside optionality (call bias).
In this chart, the risk reversal is near the bottom of its range with a three-month percentile around 11%. That means skew is tilted toward calls — traders are paying relatively more for upside calls than for downside puts.
Why does this matter? When there’s strong call bias, it often means the market is crowded long, and dealers are short calls. To hedge their short gamma, they must buy the underlying as the market rallies — reinforcing upside momentum. It’s a feedback loop: the higher spot goes, the more the dealers buy to hedge.
A persistent call bias in skew confirms that the market is positioned for further upside momentum. It also means downside protection demand is light — so a sudden crash is less likely without a new catalyst.
Vol Surface, Skew & GEX 12
Net GEX — Where Dealers Get Trapped
The third chart is your Net GEX Multi-Expirations, showing how dealer gamma exposure is distributed for multiple expiry dates. This chart tells you where spot could be pinned or where volatility could break free.
Here’s how to read it:
Positive GEX clusters near spot usually mean price will tend to pin around those levels. Dealers are long gamma and they hedge in a way that dampens volatility.
Negative GEX zones below spot indicate areas where, if price drops through, it could accelerate lower because dealers are short gamma and have to chase their hedges.
In this snapshot, the spot is around 6198, sitting near a positive GEX cluster that extends to around 6200-6250 for multiple expirations. Put support is down around 6150, and bigger negative GEX pockets sit well below that. This means price is pinned unless something big knocks it loose.
When spot sits in a positive GEX cluster, expect mean-reverting price action and muted directional movement. But if you see a break below the pinned zone, watch for sudden momentum as dealers flip from dampening flows to chasing hedges.
Vol Surface, Skew & GEX 13
How to Combine All Three
So how do you bring this together?
Volatility Surface: Shows the big picture — near-term vol is cheap, longer-term vol still commands premium. That hints that quiet mean-reversion or theta harvesting trades can work well now.
Skew: The call bias tells you the crowd is leaning bullish, and dealer hedging is likely to amplify upside. There’s less downside hedging demand, so the path of least resistance remains upward — until new puts get bought.
Net GEX: Spot is pinned near positive gamma clusters across several expirations. That further supports mean-reverting action. The floor at 6150 means a break there could open the door to bigger moves, but until then, price is sticky.
Example Strategies
Short Straddle or Iron Condor:
When you combine contango (short-term IV cheap), positive GEX pinning spot, and low put skew, you see that the market expects calm. Selling short-dated premium via straddles or condors can be effective, especially when you size carefully and hedge surprises.
Calendar Spread:
If you think back-end vol could reprice, run a calendar: sell near-term options, buy longer-dated ones. You collect decay on the front and keep exposure to longer-term risk.
Directional Plays:
If you want to lean into the call bias and momentum, you might run a slightly bullish diagonal spread — sell a short-dated ATM call, buy a longer-dated OTM call. This structure benefits if the rally continues and longer-term vol holds its premium.
Final Checks: What Could Break the Pattern?
When these signals line up, you get high confidence. But you need to monitor:
If skew shifts back to put bias, it means new downside hedging is building.
If the vol surface flattens, the term structure advantage for calendars erodes.
If spot cracks through the GEX floor, expect fast moves and vol spikes — you’ll want to hedge short gamma exposure quickly.
Conclusion
Combining these tools isn’t about overcomplicating your plan. It’s about seeing how different market layers reinforce or contradict each other. The volatility surface shows broad risk appetite. Skew shows positioning imbalances that drive flows. Net GEX tells you where those flows are likely to stick or slip.
When all three agree — calm short-term vol, bullish skew bias, and a positive GEX pin — the market is telling you where the low-stress opportunities are. As soon as they disagree, you know it’s time to manage risk and rethink your edge.
Join us today
Access daily Market Research and our interactive Dashboard. Make better trading decisions.