(function(){
var CN = 'menthorq_utm_params';
var LK = 'menthorq_utm_params';
var UK = ['utm_source','utm_medium','utm_campaign','utm_term','utm_content','utm_id'];
var CK = ['gclid','gbraid','wbraid','gad_campaignid','fbclid','msclkid','ttclid','twclid'];
// gbraid is not unique; gad_campaignid from the same hit is the campaign reference.
// Replace this whole Google bundle together so a later landing cannot pair a new gbraid with an old campaign id.
var GK = ['gclid','gbraid','wbraid','gad_campaignid'];
var CD = 30;
var AK = UK.concat(CK);function sC(n,v,d){var e=new Date(Date.now()+d*864e5).toUTCString();var c=n+'='+encodeURIComponent(v)+';expires='+e+';path=/;SameSite=Lax';if(location.protocol==='https:')c+=';Secure';document.cookie=c;}
function gC(n){var m=document.cookie.match(new RegExp('(?:^|; )'+n+'=([^;]*)'));return m?decodeURIComponent(m[1]):'';}
function sv(d){var j=JSON.stringify(d);sC(CN,j,CD);try{localStorage.setItem(LK,j);}catch(e){}}
function hk(o){if(!o)return false;for(var i=0;i<AK.length;i++)if(o[AK[i]])return true;return false;}
function nm(d){if(!d)return null;if(d.first)return d;if(hk(d))return{first:d,last:d};return null;}
function ld(){var r=gC(CN);if(r){try{var n=nm(JSON.parse(r));if(n)return n;}catch(e){}}try{var s=localStorage.getItem(LK);if(s){var n=nm(JSON.parse(s));if(n)return n;}}catch(e){}return null;}
function mg(p,n){var o={};if(p)for(var k in p)o[k]=p[k];for(var k in n)o[k]=n[k];return o;}
function hasK(o,keys){if(!o)return false;for(var i=0;i<keys.length;i++)if(o[keys[i]])return true;return false;}
function mgGoogle(p,n){
var o=mg(p,n);
if(!hasK(n,GK))return o;
for(var i=0;i<GK.length;i++){
var k=GK[i];
if(n[k])o[k]=n[k];
else delete o[k];
}
return o;
}
function completeGbraidPair(first,incoming){
if(first.gbraid && !first.gad_campaignid && incoming.gad_campaignid && incoming.gbraid===first.gbraid){
var o={};for(var k in first)o[k]=first[k];o.gad_campaignid=incoming.gad_campaignid;return o;
}
return first;
}var ps = new URLSearchParams(window.location.search);
var fd = {}, has = false;
for (var i = 0; i < AK.length; i++) {
var v = ps.get(AK[i]);
if (v) { fd[AK[i]] = v; has = true; }
}// Click-ID synthesis: when only a click-id is present (no utm_source), derive
// utm_source/utm_medium so downstream analytics groups under the right channel.
var SY = {
gclid: ['google', 'cpc'],
gbraid: ['google', 'cpc'],
wbraid: ['google', 'cpc'],
gad_campaignid: ['google', 'cpc'],
fbclid: ['facebook', 'cpc'],
msclkid: ['bing', 'cpc'],
ttclid: ['tiktok', 'cpc'],
twclid: ['twitter', 'cpc']
};
if (has && !fd.utm_source) {
for (var sk in SY) {
if (fd[sk]) { fd.utm_source = SY[sk][0]; fd.utm_medium = SY[sk][1]; break; }
}
}
if (has && !fd.utm_campaign && fd.gad_campaignid) {
fd.utm_campaign = fd.gad_campaignid;
}if (has) {
fd.captured_at = new Date().toISOString();
var ex = ld();
// Last-touch: merge new fields ON TOP of previous last (preserva campi pregressi).
// Google Ads keys are replaced as one bundle from this hit.
var newLast = ex && ex.last ? mgGoogle(ex.last, fd) : fd;
// First-touch: se ex.first ha almeno un UTM, e' completo e sticky.
// Se ex.first esiste ma e' click-id-only (orphan), completa con i campi nuovi.
// Se ex.first non esiste, usa fd come first.
// Google pair (gbraid + gad_campaignid) stays sticky once captured; only complete
// a missing campaign id when gbraid on this hit matches first-touch gbraid.
var newFirst;
if (ex && ex.first) {
var firstHasUtm = false;
for (var i = 0; i < UK.length; i++) if (ex.first[UK[i]]) { firstHasUtm = true; break; }
if (firstHasUtm || hasK(ex.first, GK)) {
newFirst = completeGbraidPair(ex.first, fd);
} else {
newFirst = mgGoogle(ex.first, fd);
}
} else {
newFirst = fd;
}
sv({first: newFirst, last: newLast});
return;
}var raw = gC(CN);
if (raw) {
try {
var p = JSON.parse(raw);
if (!p.first && hk(p)) sv({first: p, last: p});
} catch(e) {}
return;
}try {
var s = localStorage.getItem(LK);
if (s) { var n = nm(JSON.parse(s)); if (n) sv(n); }
} catch(e) {}
})();
var breeze_prefetch = {"local_url":"https://menthorq.com","ignore_remote_prefetch":"1","ignore_list":["/account/","/login/","/thank-you/","/wp-json/openid-connect/userinfo","wp-admin","wp-login.php"]};
//# sourceURL=breeze-prefetch-js-extra
Gamma Exposure Chart: Optimize Your Risk Management
Gamma Exposure Charts for Risk and Market Insight
Unlock trading insights with a gamma exposure chart.
In the world of trading, understanding your risk exposure is crucial. One way to gain insight into this is through the use of a gamma exposure chart. In this article, we’ll delve into what a gamma exposure chart is, why it’s important, and how you can access a trial version for your trading needs.
Gamma Exposure Chart: Optimize Your Risk Management 11
A gamma exposure chart is a visual representation of how gamma, a measure of the rate of change in an option’s delta, affects an options portfolio. It provides traders with insights into how price movements in the underlying asset can impact their positions. This chart is particularly valuable because it helps traders anticipate potential risks and rewards associated with their option trades.
Key Components of a Gamma Exposure Chart
Gamma Values: These indicate the sensitivity of an option’s delta to changes in the price of the underlying asset.
Delta: Represents the change in an option’s price given a one-point move in the underlying asset.
Underlying Asset Price: The current price of the asset on which the options are based.
Expiration Dates: Different gamma values exist for different expiration dates, affecting the risk assessment.
By analyzing these components, traders can gauge the risk exposure of their options portfolio.
Why is a Gamma Exposure Chart Important?
Gamma Exposure Chart: Optimize Your Risk Management 12
Understanding gamma exposure is crucial for managing risk in options trading. Here’s why:
Risk Management
Gamma exposure provides traders with a clear picture of how their portfolio might react to market movements. This insight is essential for implementing effective risk management strategies. By understanding the potential volatility of their positions, traders can make informed decisions to hedge against unfavorable price changes.
Strategic Positioning
A gamma exposure chart helps traders identify when to adjust their positions. For instance, high gamma values near an option’s expiration can indicate significant potential price swings. This knowledge allows traders to adjust their strategies proactively, optimizing for potential profits or minimizing losses.
Enhanced Decision Making
Armed with information from a gamma exposure chart, traders can make more informed decisions regarding entry and exit points in the market. Understanding the dynamics of gamma can lead to more strategic trades and improved overall performance.
For traders seeking a gamma exposure chart, there are several resources available. Here’s a look at some popular options:
TradingView’s Gamma Exposure Tool
TradingView offers a gamma exposure chart. Their tool allows traders to integrate gamma exposure analysis into their broader trading strategies.
Features: TradingView’s gamma exposure chart can be customized with various indicators and overlays, providing a comprehensive view of market dynamics.
Accessibility: Traders can access this tool by creating a free account on TradingView, enabling them to leverage gamma exposure data in their decision-making process.
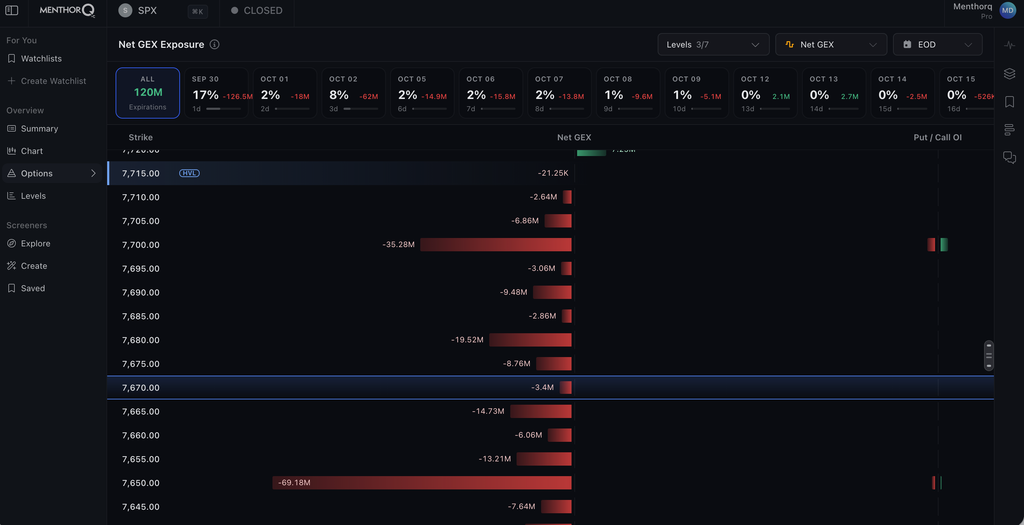
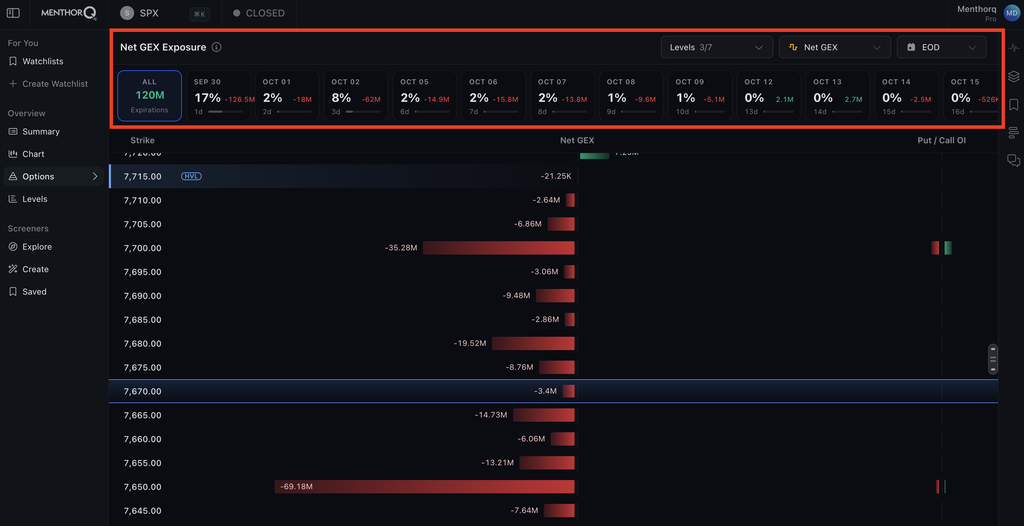
MenthorQ provides a valuable resource for traders looking to access a SPX gamma exposure chart. This tool offers insights into SPX options, allowing traders to understand the gamma exposure across various expiration dates and strike prices.
Features: MenthorQ’s chart includes detailed gamma levels, delta, and other critical metrics.
Some traders prefer to develop custom tools for analyzing gamma exposure. By utilizing programming languages like Python, traders can create personalized scripts to calculate and visualize gamma exposure tailored to their specific needs.
Features: Custom tools offer flexibility, allowing traders to focus on specific metrics and parameters.
Accessibility: While this option requires technical knowledge, numerous online resources and communities can provide guidance in developing these tools.
Making the Most of Your Gamma Exposure Chart
Gamma Exposure Chart: Optimize Your Risk Management 13
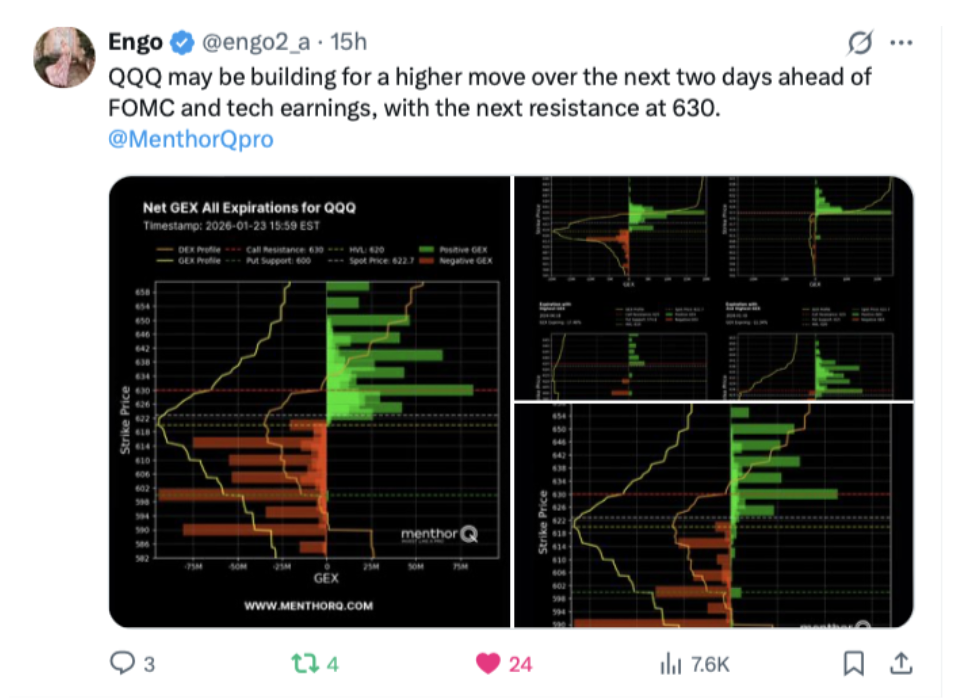
by @engo2_a on X
To fully leverage the insights from a gamma exposure chart, consider the following tips:
Regularly Monitor Your Portfolio
Consistent monitoring of your gamma exposure ensures you stay informed about any changes in risk levels. This practice is particularly important as market conditions fluctuate, and gamma values can change rapidly.
Integrate with Other Risk Management Tools
A gamma exposure chart should be part of a broader risk management strategy. By integrating it with other tools such as delta hedging and volatility analysis, traders can create a comprehensive approach to managing their positions.
Educate Yourself Continually
The world of options trading is complex and ever-evolving. To stay ahead, continually educate yourself about new strategies and tools. Participating in forums, attending webinars, and reading industry publications can enhance your understanding of gamma exposure and its implications.
Conclusion
Gamma exposure charts are indispensable tools for any serious options trader. By understanding and utilizing these charts, traders can gain valuable insights into their risk exposure, leading to more informed decision-making and improved trading outcomes. Whether you choose to access a tool like MenthorQ’s SPX gamma exposure chart or develop a custom solution, the key is to integrate this analysis into your overall trading strategy. With the right approach, you can enhance your trading performance and achieve your financial goals.
Ask QUIN to help you read and set your trading strategies.
Join us today
Access daily Market Research and our interactive Dashboard. Make better trading decisions.